Data Management: Statistics Tool
Jul 31/20
by Jason Peter Brown
Are you contracted by the same client on some jobs? Maybe the same GC or Consultant is involved? Do you work on a few different types of projects? How beneficial would it be to quickly and easily compare the performance of your projects based on related elements such as project type, client, general contractor, and employee?
Statslog has been in the construction contract admin business for over 35 years. That’s an eternity in the software business, and we’ve seen many technologies come and go. The same can’t be said of our customers though—some of our relationships go back decades. Those customers have amassed an impressive amount of project data over that time, and we’ve ensured that they can migrate it seamlessly from update to update.
The missing piece—at least up until now—is that there hasn’t been an easy way to get an arm’s length view of all that accumulated project data. We’ve traditionally considered projects to be separate silos of unrelated information, but the truth is that there are connecting threads between each and every project you work on.
Are you contracted by the same client on some jobs? Maybe the same general contractor or consultant is involved? Do you work on a few different types of projects, or have a handful of contract administrators employed to oversee them. How beneficial would it be to quickly and easily compare the performance of your projects based on related elements such as project type, client, general contractor, and employee?
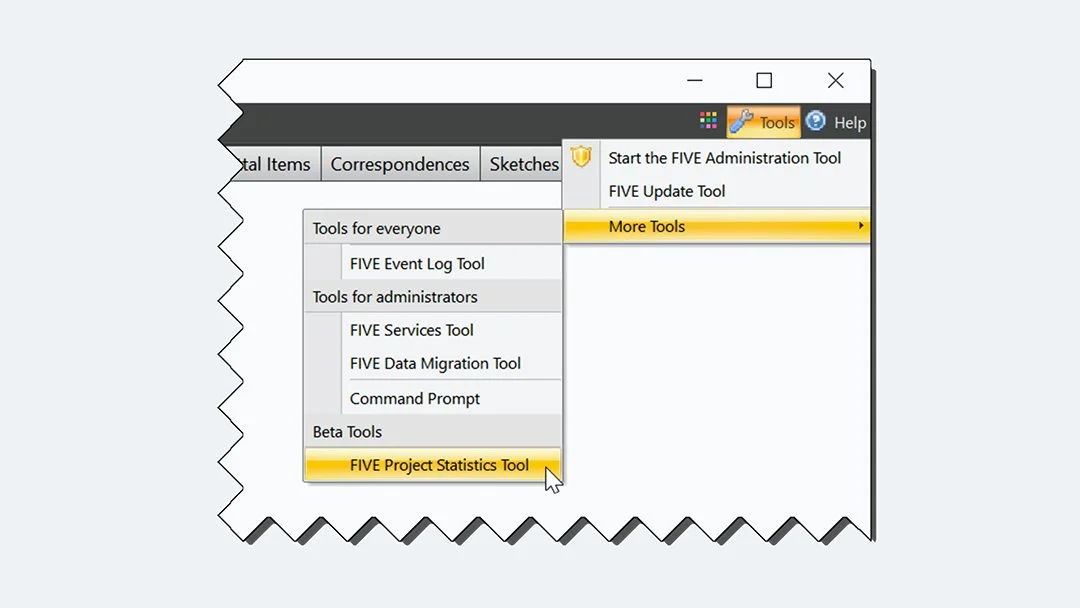
The FIVE Project Statistics Tool has long been lingering in beta behind the scenes of FIVE. A few of you have discovered it in the Tools > More Tools menu, and we’re thankful to those that have tried it, enjoyed it, and have been left wanting more. Your feedback has been instrumental in improving the tool recently, so our hats off to you early adopters and menu spelunkers!
What does the Statistics Tool do?
The FIVE Project Statistics Tool does all the grunt work of collecting and summarizing data from multiple projects into a single report – all in just a few clicks! You’ll discover that there’s a treasure trove of actionable and analyzable information right at your fingertips, available without having to open individual projects and manually group and sum values across various tabs—simply doing the minimum amount of work for the maximum amount of information sound familiar?
The FIVE Project Statistics tool includes 75 fields that are automatically populated when you run a report. It takes a just a few seconds for the tool to process each project, meaning it can churn through hundreds of project in minutes. Compared to a manual process, you can easily save hours on each run.
There are basic fields such as the project reference number, title, and category, owner, builder, designer, and contract administrator. These are useful for keyword filtering, ensuring you only see what you want to see.
There are also more advanced fields that provide information that would be difficult to gather manually.
These include:
Percent Change
The value of approved changes as a percentage of the original contract amount. This field is useful for finding projects that are exceeding thresholds for additions to your projects.Work to Date Percent
The value of the work completed to date as a percentage of the total revised contract amount. This field is useful for discovering projects that are just starting, completed, or almost completed.Work to Date (Last Year, This Year, 2 Years Ago)
These 3 fields show the total value of the work completed by calendar year. These fields are useful for determining the total value of work completed in a year for insurance purposes.Work to Date (Fiscal Years)
These 12 fields show the total value of the work completed by fiscal year (one field per month, January through December). These fields are great for determining the total value of work completed in a fiscal year, particularly for tax purposes.Changes by Reason (Amount and Percent of Original Contract)
These fields group together and total all of the approved change orders by reason. Typical reasons include things like Owner Request, Site Conditions, and Required by Authority. These fields are useful for identifying the primary reasons for project cost overruns and savings.Changes by Discipline (Amount and Percent of Original Contract)
These fields group together and total all of the approved change orders by discipline. Typical disciplines include Architectural, Mechanical, Electrical, etc. These fields are useful for identifying the disciplines that are primarily responsible for cost overruns and savings.
Want to try it?
In FIVE, click the Tools menu, then click More Tools, and then click FIVE Project Statistics Tool.
When the tool starts, click the Start button and wait while the magic happens!
Once the data has been compiled, click Export and then click Export to Excel for further analysis using tools you are already intimately familiar with.
That’s all there is to it—if you have any questions, or ideas for further enhancements to the tool, Contact Support!
Jason Peter Brown joined Statslog in 1998 as Lead Software Developer, with a goal to make the best CCA solution possible through development, training and technical support.

